Enter “Project Management” in the search field of Amazon and you get over twenty-eight thousands book titles. Just in the last 30 days, the online merchant has added more than forty new releases in this area of its library; that’s more than one book per day.
Project Management methodologies have been standardized, best practices are abundantly documented, and roadmaps to successfully execute a project are plentiful available. Then why does the Standish Group comes with the Chaos Report 2007 stating that a staggering 65% of the projects can be defined as “challenged” (over time, over budget, and/or significant functionality missing) or outright “failed”.
Top-10 factors affecting the outcome of a project
The Standish Group and many other authors have created their top-10 factors affecting the outcome of a project. These lists are very similar and most of them include the following items:
- Incomplete and/or changing requirements
- Low end-user involvement
- Low resource availability
- Unrealistic expectations
- Little executive support
- Little IT management support
- Lack of planning
- System / application no longer needed
- Bleeding-edge technology
- Other / miscellaneous
Once again, it seems rather difficult to understand why with so much knowledge at hand and well listed pitfalls, only 35% of the projects are completed on time, on budget, and on target.
The main reasons for these numbers can be attached to the fact that project management is not an exact science. The outcome of a project is impacted by unquantifiable human factors, by immeasurable business variables, and by incalculable external hazards. To alleviate these threats, the good project manager establishes a risk list giving him a gut feeling about his chances of success.
Project Success Assessment Tool
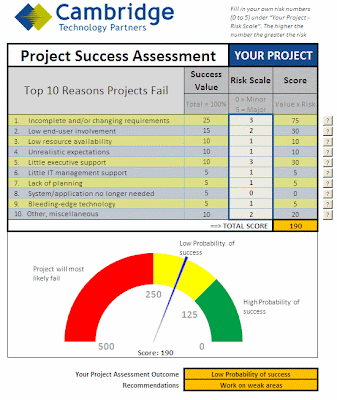
To replace this “gut-feeling” by more tangible numbers, Cambridge Technology Partners uses a tool allowing its consultants to rapidly forecast the success of technology projects and to help them focusing on the most threatening factors.
CTP uses its own experience combined with the statistics published by the Standish Group to assign a probability to each factor.
for example:
“incomplete and/or changing requirements” is defined to represent on average 25% of the risks acting against the successful completion of a project.
Then for each item of the list, the project manager associates a risk scale from 0 (minor risk) to 5 (major risk).
By multiplying each risk probability with its associated risk scale, and by adding all these results, the user obtains a total score. This total score is finally compared to a scale assessing your chances of project success and the actions that may be required.
The Figure 2 below shows the project success probability for the hypothetical implementation of an ECM solution. The table clearly demonstrates that the project manager should work on the risks related to the requirements and the expectations before going any further.

Please contact Cambridge Technology Partner if you like to have a copy of the Project Success Assessment tool. If you use it, please, provide us with your feedback, so we can improve it or help you in any other ways to put your projects on the right tracks.
Cambridge’s project managers are incented to become Project Management Professionals (PMP), certified through the Institute, as well as participate in continuing education programs. Its business analysts are following a similar path towards IIBA certification from the International Institute of Business Analysis.

No comments:
Post a Comment